


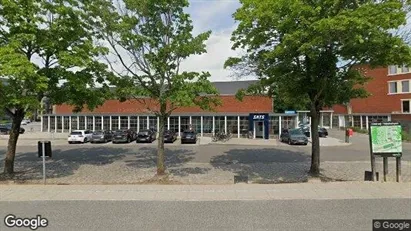
Commercial premises in Søborg
Companyspace.com today:
New today 735
Updated 24h 1,317
Notifications about new companyspaces1,911
Copenhagen +2
Stockholm +1
Vienna +19
Paris +6
Madrid +13
Dublin (county) +54
Warsaw +4
Greater London +8
Latest update 1 h ago
Active ads 361,692
146 company spaces found
Warehouse in Søborg, Greater Copenhagen
 More info
Warehouse in Søborg, Greater Copenhagen
Warehouse for rent in Søborg, Greater Copenhagen
Areal
Ca. 6,725 m2
Pris pr. md.
Not stated
Område
Søborg, Greater Copenhagen
Type
Warehouse
Warehouse property in Søborg, Greater Copenhagen
 More info
Warehouse property in Søborg, Greater Copenhagen
Warehouse for sale in Søborg, Greater Copenhagen
Areal
-
Pris
Not stated
Område
Søborg, Greater Copenhagen
Type
Warehouse
Office space in Søborg, Greater Copenhagen
 More info
Office space in Søborg, Greater Copenhagen
Office space for rent in Søborg, Greater Copenhagen
Areal
Ca. 545 m2
Pris pr. md.
Not stated
Område
Søborg, Greater Copenhagen
Type
Office space
Warehouse in Søborg, Greater Copenhagen
 More info
Warehouse in Søborg, Greater Copenhagen
Warehouse for rent in Søborg, Greater Copenhagen
Areal
Ca. 110 m2
Pris pr. md.
Not stated
Område
Søborg, Greater Copenhagen
Type
Warehouse
Warehouse in Søborg, Greater Copenhagen
More info
Warehouse in Søborg, Greater Copenhagen
Warehouse for rent in Søborg, Greater Copenhagen
Areal
Ca. 110 m2
Pris pr. md.
Not stated
Område
Søborg, Greater Copenhagen
Type
Warehouse
Shop in Søborg, Greater Copenhagen
More info
We monitor the market!
Shop in Søborg, Greater Copenhagen
Shop for rent in Søborg, Greater Copenhagen
Areal
Ca. 85 m2
Pris pr. md.
Not stated
Område
Søborg, Greater Copenhagen
Type
Shop
Warehouse in Søborg, Greater Copenhagen
 More info
Warehouse in Søborg, Greater Copenhagen
Warehouse for rent in Søborg, Greater Copenhagen
Areal
Ca. 130 m2
Pris pr. md.
Not stated
Område
Søborg, Greater Copenhagen
Type
Warehouse
Office space in Søborg, Greater Copenhagen
 More info
Office space in Søborg, Greater Copenhagen
Office space for rent in Søborg, Greater Copenhagen
Areal
Ca. 395 m2
Pris pr. md.
Not stated
Område
Søborg, Greater Copenhagen
Type
Office space
Warehouse in Søborg, Greater Copenhagen
 More info
Warehouse in Søborg, Greater Copenhagen
Warehouse for rent in Søborg, Greater Copenhagen
Areal
Ca. 130 m2
Pris pr. md.
Not stated
Område
Søborg, Greater Copenhagen
Type
Warehouse
Warehouse property in Søborg, Greater Copenhagen
More info
Warehouse property in Søborg, Greater Copenhagen
Warehouse for sale in Søborg, Greater Copenhagen
Areal
-
Pris
Not stated
Område
Søborg, Greater Copenhagen
Type
Warehouse
Office space in Søborg, Greater Copenhagen
More info
Office space in Søborg, Greater Copenhagen
Office space for rent in Søborg, Greater Copenhagen
Areal
Ca. 2,010 m2
Pris pr. md.
Not stated
Område
Søborg, Greater Copenhagen
Type
Office space
Office space in Søborg, Greater Copenhagen
More info
Office space in Søborg, Greater Copenhagen
Office space for rent in Søborg, Greater Copenhagen
Areal
Ca. 1,440 m2
Pris pr. md.
Not stated
Område
Søborg, Greater Copenhagen
Type
Office space
Office space in Søborg, Greater Copenhagen
More info
Office space in Søborg, Greater Copenhagen
Office space for rent in Søborg, Greater Copenhagen
Areal
Ca. 525 m2
Pris pr. md.
Not stated
Område
Søborg, Greater Copenhagen
Type
Office space
Office space in Søborg, Greater Copenhagen
More info
Office space in Søborg, Greater Copenhagen
Office space for rent in Søborg, Greater Copenhagen
Areal
Ca. 645 m2
Pris pr. md.
Not stated
Område
Søborg, Greater Copenhagen
Type
Office space
Office space in Søborg, Greater Copenhagen
More info
Office space in Søborg, Greater Copenhagen
Office space for rent in Søborg, Greater Copenhagen
Areal
Ca. 4,240 m2
Pris pr. md.
Not stated
Område
Søborg, Greater Copenhagen
Type
Office space
Office space in Søborg, Greater Copenhagen
More info
Office space in Søborg, Greater Copenhagen
Office space for rent in Søborg, Greater Copenhagen
Areal
Ca. 1,280 m2
Pris pr. md.
Not stated
Område
Søborg, Greater Copenhagen
Type
Office space
Office space in Søborg, Greater Copenhagen
More info
Office space in Søborg, Greater Copenhagen
Office space for rent in Søborg, Greater Copenhagen
Areal
Ca. 235 m2
Pris pr. md.
Not stated
Område
Søborg, Greater Copenhagen
Type
Office space
Office space in Søborg, Greater Copenhagen
 More info
Office space in Søborg, Greater Copenhagen
Office space for rent in Søborg, Greater Copenhagen
Areal
Ca. 295 m2
Pris pr. md.
Not stated
Område
Søborg, Greater Copenhagen
Type
Office space
Selected customers
30,000 customers use Companyspace.com
30,000 customers
285,000 companies in our database
2,400 rentals annually
Companyspace.com is used by thousands of landlords, property companies, commercial real estate agents, investors and business centres seeking greater visibility, more enquiries and lower vacancy rates.


