


Commercial premises in Nyborg
Companyspace.com today:
New today 1,647
Updated 24h 1,647
Notifications about new companyspaces2,267
Stockholm +5
Amsterdam +4
Berlin +7
Oslo +2
Brussels +21
Vienna +60
Paris +9
Madrid +1
Dublin (county) +36
Warsaw +59
Roma (region) +1
Greater London +13
Latest update 8 min ago
Active ads 361,223
90 company spaces found
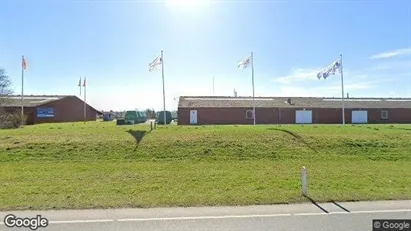
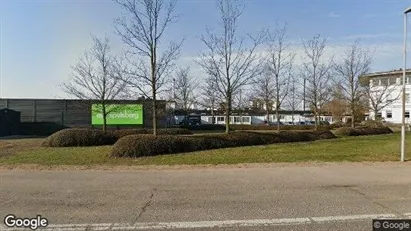
Office space in Nyborg, Funen
 More info
Office space in Nyborg, Funen
Office space for rent in Nyborg, Funen
Areal
Ca. 365 m2
Pris pr. md.
Ca. 12,350 DKK pr md
Område
Nyborg, Funen
Type
Office space
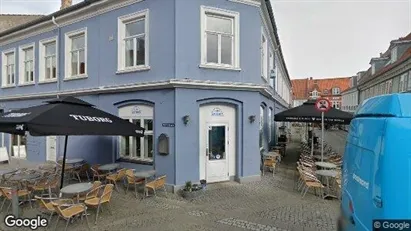
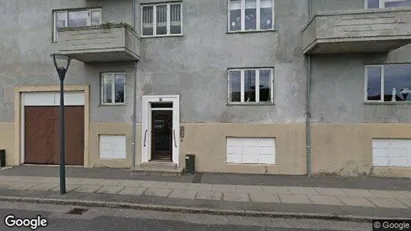
Commercial space in Nyborg, Funen
 More info
Commercial space in Nyborg, Funen
Commercial space for rent in Nyborg, Funen
Areal
Ca. 175 m2
Pris pr. md.
Ca. 29,900 DKK pr md
Område
Nyborg, Funen
Type
Commercial property
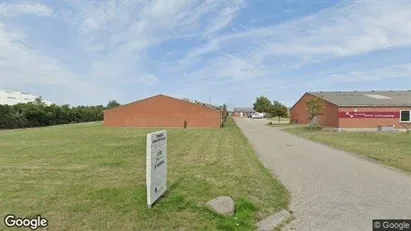
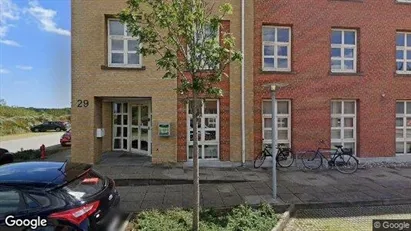
Warehouse in Nyborg, Funen
 More info
Warehouse in Nyborg, Funen
Warehouse for rent in Nyborg, Funen
Areal
Ca. 365 m2
Pris pr. md.
Ca. 12,350 DKK pr md
Område
Nyborg, Funen
Type
Warehouse
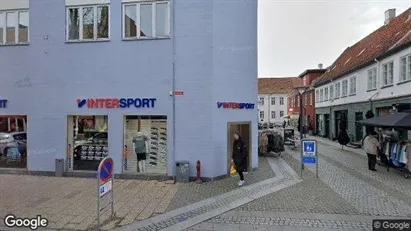
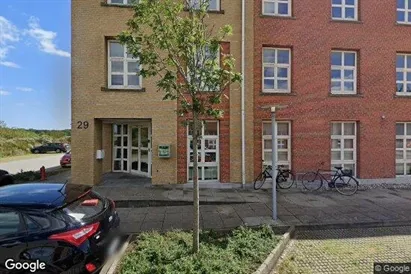
Office space in Nyborg, Funen
 More info
Office space in Nyborg, Funen
Office space for rent in Nyborg, Funen
Areal
Ca. 310 m2
Pris pr. md.
Ca. 16,800 DKK pr md
Område
Nyborg, Funen
Type
Office space
Office space in Nyborg, Funen
 More info
Office space in Nyborg, Funen
Office space for rent in Nyborg, Funen
Areal
Ca. 1,170 m2
Pris pr. md.
Ca. 55,400 DKK pr md
Område
Nyborg, Funen
Type
Office space
Commercial space in Nyborg, Funen
 More info
Commercial space in Nyborg, Funen
Commercial space for rent in Nyborg, Funen
Areal
Ca. 605 m2
Pris pr. md.
Ca. 32,950 DKK pr md
Område
Nyborg, Funen
Type
Commercial property
Office space in Nyborg, Funen
 More info
Office space in Nyborg, Funen
Office space for rent in Nyborg, Funen
Areal
Ca. 195 m2
Pris pr. md.
Ca. 11,450 DKK pr md
Område
Nyborg, Funen
Type
Office space
Office space in Nyborg, Funen
 More info
Office space in Nyborg, Funen
Office space for rent in Nyborg, Funen
Areal
Ca. 120 m2
Pris pr. md.
Ca. 8,500 DKK pr md
Område
Nyborg, Funen
Type
Office space
Office space in Nyborg, Funen
 More info
Office space in Nyborg, Funen
Office space for rent in Nyborg, Funen
Areal
Ca. 15 m2
Pris pr. md.
Ca. 1,150 DKK pr md
Område
Nyborg, Funen
Type
Office space
Office space in Nyborg, Funen
 More info
Office space in Nyborg, Funen
Office space for rent in Nyborg, Funen
Areal
Ca. 15 m2
Pris pr. md.
Ca. 800 DKK pr md
Område
Nyborg, Funen
Type
Office space
Office space in Nyborg, Funen
 More info
Office space in Nyborg, Funen
Office space for rent in Nyborg, Funen
Areal
Ca. 250 m2
Pris pr. md.
Ca. 14,600 DKK pr md
Område
Nyborg, Funen
Type
Office space
Office space in Nyborg, Funen
 More info
Office space in Nyborg, Funen
Office space for rent in Nyborg, Funen
Areal
Ca. 100 m2
Pris pr. md.
Ca. 5,850 DKK pr md
Område
Nyborg, Funen
Type
Office space
Office space in Nyborg, Funen
 More info
Office space in Nyborg, Funen
Office space for rent in Nyborg, Funen
Areal
Ca. 500 m2
Pris pr. md.
Ca. 29,150 DKK pr md
Område
Nyborg, Funen
Type
Office space
Office space in Nyborg, Funen
 More info
Office space in Nyborg, Funen
Office space for rent in Nyborg, Funen
Areal
Ca. 55 m2
Pris pr. md.
Ca. 3,250 DKK pr md
Område
Nyborg, Funen
Type
Office space
Office space in Nyborg, Funen
 More info
Office space in Nyborg, Funen
Office space for rent in Nyborg, Funen
Areal
Ca. 30 m2
Pris pr. md.
Ca. 1,650 DKK pr md
Område
Nyborg, Funen
Type
Office space
Office space in Nyborg, Funen
 More info
Office space in Nyborg, Funen
Office space for rent in Nyborg, Funen
Areal
Ca. 75 m2
Pris pr. md.
Ca. 4,400 DKK pr md
Område
Nyborg, Funen
Type
Office space
Office space in Nyborg, Funen
More info
We monitor the market!
Office space in Nyborg, Funen
Office space for rent in Nyborg, Funen
Areal
Ca. 20 m2
Pris pr. md.
Ca. 147,550 DKK pr md
Område
Nyborg, Funen
Type
Office space
Office space in Nyborg, Funen
More info
We monitor the market!
Office space in Nyborg, Funen
Office space for rent in Nyborg, Funen
Areal
Ca. 20 m2
Pris pr. md.
Ca. 147,550 DKK pr md
Område
Nyborg, Funen
Type
Office space
Selected customers
30,000 customers use Companyspace.com
30,000 customers
285,000 companies in our database
2,400 rentals annually
Companyspace.com is used by thousands of landlords, property companies, commercial real estate agents, investors and business centres seeking greater visibility, more enquiries and lower vacancy rates.


