


Commercial premises in Grindsted
Companyspace.com today:
New today 285
Updated 24h 1,029
Notifications about new companyspaces41
Copenhagen +5
Amsterdam +1
Berlin +3
Brussels +2
Vienna +1
Warsaw +12
Roma (region) +1
Latest update 1 min ago
Active ads 364,282
50 company spaces found
Restaurant in Grindsted, Region of Southern Denmark
 More info
Restaurant in Grindsted, Region of Southern Denmark
Restaurant for rent in Grindsted, Region of Southern Denmark
Areal
Ca. 300 m2
Pris pr. md.
Ca. 14,000 DKK per month
Område
Grindsted, Region of Southern Denmark
Type
Restaurant
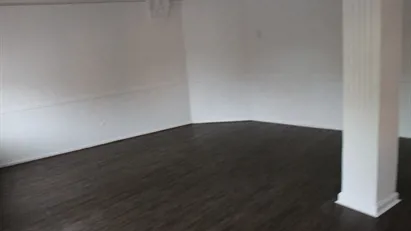
Office space in Grindsted, Region of Southern Denmark
 More info
Office space in Grindsted, Region of Southern Denmark
Office space for rent in Grindsted, Region of Southern Denmark
Areal
Ca. 380 m2
Pris pr. md.
Ca. 17,000 DKK per month
Område
Grindsted, Region of Southern Denmark
Type
Office space
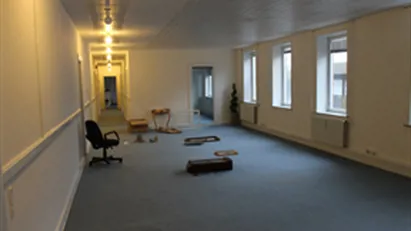
Office space in Grindsted, Region of Southern Denmark
 More info
Office space in Grindsted, Region of Southern Denmark
Office space for rent in Grindsted, Region of Southern Denmark
Areal
Ca. 220 m2
Pris pr. md.
Ca. 8,000 DKK per month
Område
Grindsted, Region of Southern Denmark
Type
Office space
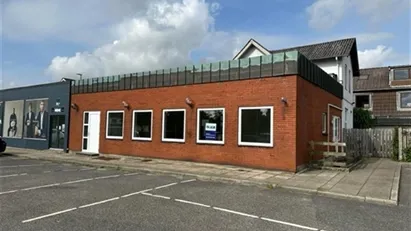
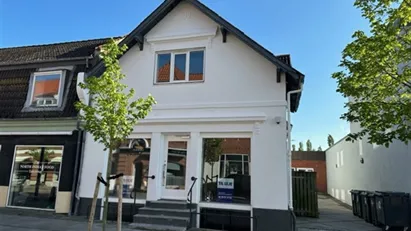
Shop in Grindsted, Region of Southern Denmark
 More info
Shop in Grindsted, Region of Southern Denmark
Shop for rent in Grindsted, Region of Southern Denmark
Areal
Ca. 345 m2
Pris pr. md.
Not stated
Område
Grindsted, Region of Southern Denmark
Type
Shop
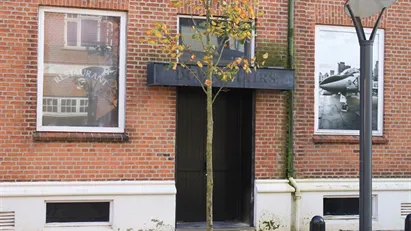
Office space in Grindsted, Region of Southern Denmark
 More info
Office space in Grindsted, Region of Southern Denmark
Office space for rent in Grindsted, Region of Southern Denmark
Areal
Ca. 55 m2
Pris pr. md.
Ca. 3,500 DKK per month
Område
Grindsted, Region of Southern Denmark
Type
Office space
Shop in Grindsted, Region of Southern Denmark
 More info
Shop in Grindsted, Region of Southern Denmark
Shop for rent in Grindsted, Region of Southern Denmark
Areal
Ca. 130 m2
Pris pr. md.
Ca. 4,000 DKK per month
Område
Grindsted, Region of Southern Denmark
Type
Shop
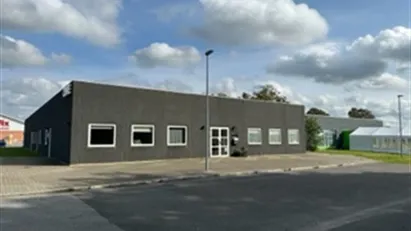
Industrial property in Grindsted, Region of Southern Denmark
 More info
Industrial property in Grindsted, Region of Southern Denmark
Industrial property for rent in Grindsted, Region of Southern Denmark
Areal
Ca. 1,960 m2
Pris pr. md.
Ca. 57,100 DKK per month
Område
Grindsted, Region of Southern Denmark
Type
Industrial property
Warehouse in Grindsted, Region of Southern Denmark
 More info
Warehouse in Grindsted, Region of Southern Denmark
Warehouse for rent in Grindsted, Region of Southern Denmark
Areal
Ca. 280 m2
Pris pr. md.
Ca. 8,250 DKK per month
Område
Grindsted, Region of Southern Denmark
Type
Warehouse
Office space in Grindsted, Region of Southern Denmark
 More info
Office space in Grindsted, Region of Southern Denmark
Office space for rent in Grindsted, Region of Southern Denmark
Areal
Ca. 380 m2
Pris pr. md.
Ca. 15,000 DKK per month
Område
Grindsted, Region of Southern Denmark
Type
Office space
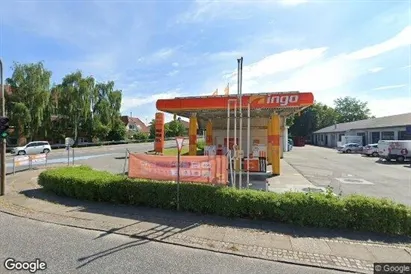
Commercial space in Grindsted, Region of Southern Denmark
 More info
Commercial space in Grindsted, Region of Southern Denmark
Commercial space for rent in Grindsted, Region of Southern Denmark
Areal
Ca. 1,200 m2
Pris pr. md.
Ca. 8,500 DKK per month
Område
Grindsted, Region of Southern Denmark
Type
Commercial property
Office space in Grindsted, Region of Southern Denmark
 More info
Office space in Grindsted, Region of Southern Denmark
Office space for rent in Grindsted, Region of Southern Denmark
Areal
Ca. 380 m2
Pris pr. md.
Ca. 17,000 DKK per month
Område
Grindsted, Region of Southern Denmark
Type
Office space
Restaurant in Grindsted, Region of Southern Denmark
 More info
Restaurant in Grindsted, Region of Southern Denmark
Restaurant for rent in Grindsted, Region of Southern Denmark
Areal
Ca. 300 m2
Pris pr. md.
Ca. 14,000 DKK per month
Område
Grindsted, Region of Southern Denmark
Type
Restaurant
Commercial space in Grindsted, Region of Southern Denmark
 More info
Commercial space in Grindsted, Region of Southern Denmark
Commercial space for rent in Grindsted, Region of Southern Denmark
Areal
Ca. 1,200 m2
Pris pr. md.
Ca. 8,500 DKK per month
Område
Grindsted, Region of Southern Denmark
Type
Commercial property
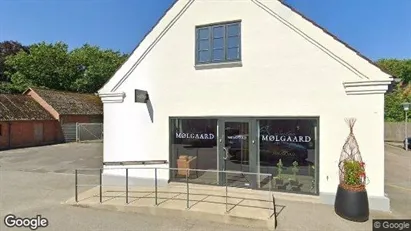
Shop in Grindsted, Region of Southern Denmark
 More info
Shop in Grindsted, Region of Southern Denmark
Shop for rent in Grindsted, Region of Southern Denmark
Areal
Ca. 345 m2
Pris pr. md.
Not stated
Område
Grindsted, Region of Southern Denmark
Type
Shop
Office space in Grindsted, Region of Southern Denmark
 More info
Office space in Grindsted, Region of Southern Denmark
Office space for rent in Grindsted, Region of Southern Denmark
Areal
Ca. 55 m2
Pris pr. md.
Ca. 3,500 DKK per month
Område
Grindsted, Region of Southern Denmark
Type
Office space
Shop in Grindsted, Region of Southern Denmark
More info
Shop in Grindsted, Region of Southern Denmark
Shop for rent in Grindsted, Region of Southern Denmark
Areal
Ca. 80 m2
Pris pr. md.
Ca. 5,200 DKK per month
Område
Grindsted, Region of Southern Denmark
Type
Shop
Restaurant in Grindsted, Region of Southern Denmark
More info
Restaurant in Grindsted, Region of Southern Denmark
Restaurant for rent in Grindsted, Region of Southern Denmark
Areal
Ca. 350 m2
Pris pr. md.
Ca. 10,000 DKK per month
Område
Grindsted, Region of Southern Denmark
Type
Restaurant
Shop in Grindsted, Region of Southern Denmark
More info
Shop in Grindsted, Region of Southern Denmark
Shop for rent in Grindsted, Region of Southern Denmark
Areal
Ca. 350 m2
Pris pr. md.
Ca. 10,000 DKK per month
Område
Grindsted, Region of Southern Denmark
Type
Shop
Selected customers
Selected customers
30,000 customers use Companyspace.com
30,000 customers
285,000 companies in our database
2,400 rentals annually
Companyspace.com is used by thousands of landlords, property companies, commercial real estate agents, investors and business centres seeking greater visibility, more enquiries and lower vacancy rates.


