


Commercial premises in Europe
Companyspace.com today:
New today 904
Updated 24h 1,184
Notifications about new companyspaces2,188
Copenhagen +3
Amsterdam +17
Berlin +14
Brussels +2
Vienna +14
Dublin (county) +44
Warsaw +47
Latest update 50 min ago
Active ads 360,382
360,382 company spaces found
Commercial space in Tampere Keskinen, Tampere
 More info
Commercial space in Tampere Keskinen, Tampere
Commercial space for rent in Tampere Keskinen, Tampere
Areal
-
Pris pr. md.
Ca. 1,300 EUR pr md
Område
Tampere Keskinen, Tampere
Type
Commercial property
Warehouse property in Napoli Municipalità 3, Napoli
 More info
Warehouse property in Napoli Municipalità 3, Napoli
Warehouse for sale in Napoli Municipalità 3, Napoli
Areal
Ca. 40 m2
Pris
Ca. 1,000EUR
Område
Napoli Municipalità 3, Napoli
Type
Warehouse
Commercial space in Huizen, North Holland
 More info
Commercial space in Huizen, North Holland
Commercial space for rent in Huizen, North Holland
Areal
-
Pris pr. md.
Ca. 4,250 EUR pr md
Område
Huizen, North Holland
Type
Commercial property
Office space in Leipzig, Sachsen
 More info
Office space in Leipzig, Sachsen
Office space for rent in Leipzig, Sachsen
Areal
Ca. 29,220 m2
Pris pr. md.
Not stated
Område
Leipzig, Sachsen
Type
Office space
Office property in Roma Municipio IX – EUR, Roma (region)
 More info
Office property in Roma Municipio IX – EUR, Roma (region)
Office space for sale in Roma Municipio IX – EUR, Roma (region)
Areal
Ca. 235 m2
Pris
Ca. 1,000EUR
Område
Roma Municipio IX – EUR, Roma (region)
Type
Office space
Warehouse property in Roma Municipio XIII – Aurelia, Roma (region)
 More info
Warehouse property in Roma Municipio XIII – Aurelia, Roma (region)
Warehouse for sale in Roma Municipio XIII – Aurelia, Roma (region)
Areal
Ca. 100 m2
Pris
Ca. 1,000EUR
Område
Roma Municipio XIII – Aurelia, Roma (region)
Type
Warehouse
Commercial property in Wommelgem, Antwerp (Province)
 More info
Commercial property in Wommelgem, Antwerp (Province)
Commercial property for sale in Wommelgem, Antwerp (Province)
Areal
Ca. 215 m2
Pris
Ca. 525,000EUR
Område
Wommelgem, Antwerp (Province)
Type
Commercial property
Office space in Frederiksberg C, Copenhagen
 More info
Office space in Frederiksberg C, Copenhagen
Office space for rent in Frederiksberg C, Copenhagen
Areal
Ca. 25 m2
Pris pr. md.
Ca. 9,150 DKK pr md
Område
Frederiksberg C, Copenhagen
Type
Office space
Office space in Helsinki Eteläinen, Helsinki
 More info
Office space in Helsinki Eteläinen, Helsinki
Office space for rent in Helsinki Eteläinen, Helsinki
Areal
Ca. 160 m2
Pris pr. md.
Not stated
Område
Helsinki Eteläinen, Helsinki
Type
Office space
Commercial property in Almere, Flevoland
 More info
Commercial property in Almere, Flevoland
Commercial property for sale in Almere, Flevoland
Areal
Ca. 295 m2
Pris
Ca. 550,000EUR
Område
Almere, Flevoland
Type
Commercial property
Commercial space in Fredericia, Region of Southern Denmark
 More info
Commercial space in Fredericia, Region of Southern Denmark
Commercial space for rent in Fredericia, Region of Southern Denmark
Areal
Ca. 140 m2
Pris pr. md.
Ca. 9,650 DKK pr md
Område
Fredericia, Region of Southern Denmark
Type
Commercial property
Office space in Eindhoven, North Brabant
 More info
Office space in Eindhoven, North Brabant
Office space for rent in Eindhoven, North Brabant
Areal
Ca. 95 m2
Pris pr. md.
Ca. 50 EUR pr md
Område
Eindhoven, North Brabant
Type
Office space
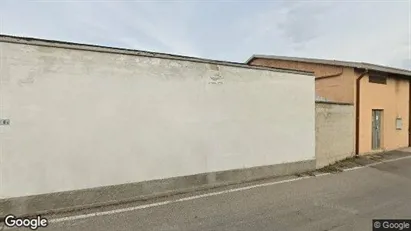
Warehouse property in Burago di Molgora, Lombardia
 More info
Warehouse property in Burago di Molgora, Lombardia
Warehouse for sale in Burago di Molgora, Lombardia
Areal
Ca. 100 m2
Pris
Ca. 180,000EUR
Område
Burago di Molgora, Lombardia
Type
Warehouse
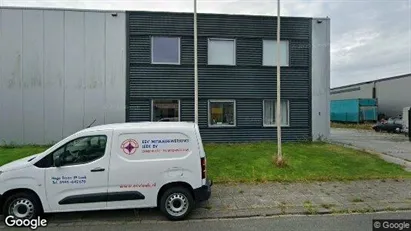
Office space in Leek, Groningen (region)
 More info
Office space in Leek, Groningen (region)
Office space for rent in Leek, Groningen (region)
Areal
Ca. 175 m2
Pris pr. md.
Ca. 400 EUR pr md
Område
Leek, Groningen (region)
Type
Office space
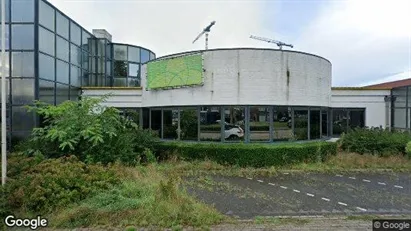
Commercial space in Maasdriel, Gelderland
 More info
Commercial space in Maasdriel, Gelderland
Commercial space for rent in Maasdriel, Gelderland
Areal
Ca. 150 m2
Pris pr. md.
Ca. 1,650 EUR pr md
Område
Maasdriel, Gelderland
Type
Commercial property
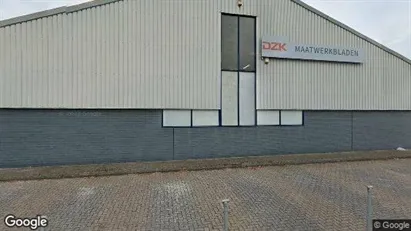
Commercial space in Leek, Groningen (region)
 More info
Commercial space in Leek, Groningen (region)
Commercial space for rent in Leek, Groningen (region)
Areal
Ca. 770 m2
Pris pr. md.
Not stated
Område
Leek, Groningen (region)
Type
Commercial property
Office space in Roskilde, Greater Copenhagen
 More info
Office space in Roskilde, Greater Copenhagen
Office space for rent in Roskilde, Greater Copenhagen
Areal
Ca. 6,235 m2
Pris pr. md.
Ca. 620,700 DKK pr md
Område
Roskilde, Greater Copenhagen
Type
Office space
Commercial space in Aalborg, Aalborg (region)
 More info
Commercial space in Aalborg, Aalborg (region)
Commercial space for rent in Aalborg, Aalborg (region)
Areal
-
Pris pr. md.
Ca. 2,450 DKK pr md
Område
Aalborg, Aalborg (region)
Type
Commercial property
Selected customers
30,000 customers use Companyspace.com
30,000 customers
285,000 companies in our database
2,400 rentals annually
Companyspace.com is used by thousands of landlords, property companies, commercial real estate agents, investors and business centres seeking greater visibility, more enquiries and lower vacancy rates.


