


Commercial premises in Europe
Companyspace.com today:
New today 143
Updated 24h 631
Notifications about new companyspaces20
Copenhagen +1
Stockholm +1
Dublin (county) +1
Warsaw +3
Latest update 19 min ago
Active ads 364,332
364,334 company spaces found
Office space in Aalborg Øst, Aalborg (region)
 More info
Office space in Aalborg Øst, Aalborg (region)
Office space for rent in Aalborg Øst, Aalborg (region)
Areal
Ca. 495 m2
Pris pr. md.
Ca. 22,100 DKK per month
Område
Aalborg Øst, Aalborg (region)
Type
Office space
Commercial space in Frankfurt Süd, Frankfurt (region)
 More info
Commercial space in Frankfurt Süd, Frankfurt (region)
Commercial space for rent in Frankfurt Süd, Frankfurt (region)
Areal
Ca. 125 m2
Pris pr. md.
Not stated
Område
Frankfurt Süd, Frankfurt (region)
Type
Commercial property
Office space in Hillerød, North Zealand
 More info
Office space in Hillerød, North Zealand
Office space for rent in Hillerød, North Zealand
Areal
Ca. 405 m2
Pris pr. md.
Ca. 27,050 DKK per month
Område
Hillerød, North Zealand
Type
Office space
Warehouse in Horsens, Central Jutland Region
 More info
Warehouse in Horsens, Central Jutland Region
Warehouse for rent in Horsens, Central Jutland Region
Areal
Ca. 1,100 m2
Pris pr. md.
Ca. 65,850 DKK per month
Område
Horsens, Central Jutland Region
Type
Warehouse
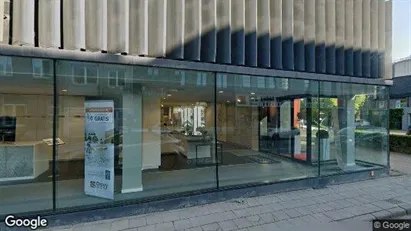
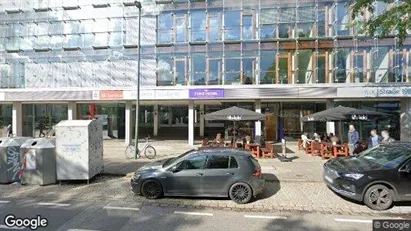
Office space in Utrecht Binnenstad, Utrecht
 More info
Office space in Utrecht Binnenstad, Utrecht
Office space for rent in Utrecht Binnenstad, Utrecht
Areal
Ca. 120 m2
Pris pr. md.
Ca. 4,250 EUR per month
Område
Utrecht Binnenstad, Utrecht
Type
Office space
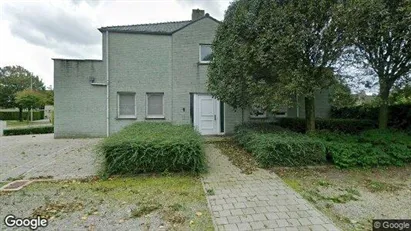
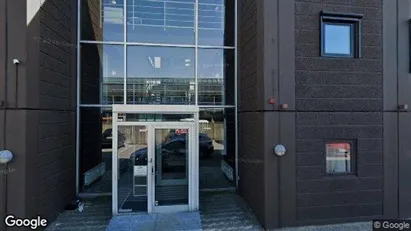
Office property in Hoogstraten, Antwerp (Province)
 More info
Office property in Hoogstraten, Antwerp (Province)
Office space for sale in Hoogstraten, Antwerp (Province)
Areal
Ca. 320 m2
Pris
Ca. 695,000EUR
Område
Hoogstraten, Antwerp (Province)
Type
Office space
Commercial space in Aalst, Oost-Vlaanderen
 More info
Commercial space in Aalst, Oost-Vlaanderen
Commercial space for rent in Aalst, Oost-Vlaanderen
Areal
-
Pris pr. md.
Ca. 3,350 EUR per month
Område
Aalst, Oost-Vlaanderen
Type
Commercial property
Commercial property in Emmen, Drenthe
 More info
Commercial property in Emmen, Drenthe
Commercial property te koop in Emmen, Drenthe
Areal
-
Pris
Ca. 800,000EUR
Område
Emmen, Drenthe
Type
Commercial property
Commercial space in Dusseldorf, Nordrhein-Westfalen
 More info
Commercial space in Dusseldorf, Nordrhein-Westfalen
Commercial space for rent in Dusseldorf, Nordrhein-Westfalen
Areal
Ca. 10 m2
Pris pr. md.
Ca. 200 EUR per month
Område
Dusseldorf, Nordrhein-Westfalen
Type
Commercial property
Commercial space in Frederiksberg, Copenhagen
 More info
Commercial space in Frederiksberg, Copenhagen
Commercial space for rent in Frederiksberg, Copenhagen
Areal
Ca. 270 m2
Pris pr. md.
Ca. 17,100 DKK per month
Område
Frederiksberg, Copenhagen
Type
Commercial property
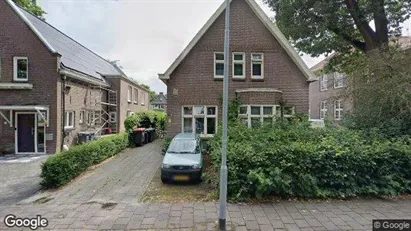
Office space in Amsterdam Zuideramstel, Amsterdam
 More info
Office space in Amsterdam Zuideramstel, Amsterdam
Office space for rent in Amsterdam Zuideramstel, Amsterdam
Areal
Ca. 110 m2
Pris pr. md.
Ca. 4,400 EUR per month
Område
Amsterdam Zuideramstel, Amsterdam
Type
Office space
Commercial space in Breda, North Brabant
 More info
Commercial space in Breda, North Brabant
Commercial space for rent in Breda, North Brabant
Areal
Ca. 145 m2
Pris pr. md.
Ca. 2,000 EUR per month
Område
Breda, North Brabant
Type
Commercial property
Office space in Leerdam, South Holland
 More info
Office space in Leerdam, South Holland
Office space for rent in Leerdam, South Holland
Areal
Ca. 340 m2
Pris pr. md.
Ca. 2,500 EUR per month
Område
Leerdam, South Holland
Type
Office space
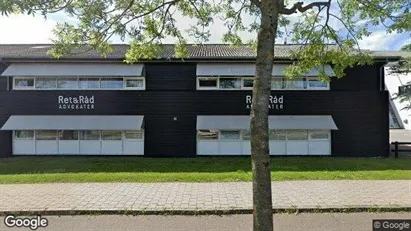
Office space in Randers C, Randers
 More info
Office space in Randers C, Randers
Office space for rent in Randers C, Randers
Areal
Ca. 445 m2
Pris pr. md.
Ca. 20,000 DKK per month
Område
Randers C, Randers
Type
Office space
Warehouse in Padborg, Region of Southern Denmark
 More info
Warehouse in Padborg, Region of Southern Denmark
Warehouse for rent in Padborg, Region of Southern Denmark
Areal
Ca. 2,820 m2
Pris pr. md.
Ca. 77,350 DKK per month
Område
Padborg, Region of Southern Denmark
Type
Warehouse
Industrial property in Tampere Keskinen, Tampere
 More info
Industrial property in Tampere Keskinen, Tampere
Industrial property for rent in Tampere Keskinen, Tampere
Areal
-
Pris pr. md.
Ca. 3,350 EUR per month
Område
Tampere Keskinen, Tampere
Type
Industrial property
Industrial property in Järvenpää, Uusimaa
 More info
Industrial property in Järvenpää, Uusimaa
Industrial property for rent in Järvenpää, Uusimaa
Areal
Ca. 135 m2
Pris pr. md.
Ca. 1,250 EUR per month
Område
Järvenpää, Uusimaa
Type
Industrial property
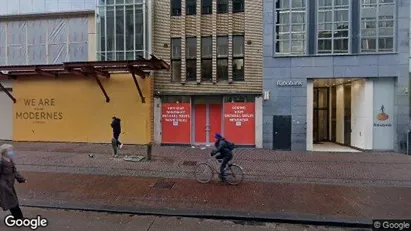
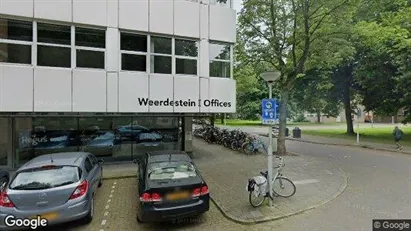
Office space in The Hague Centrum, The Hague
 More info
Office space in The Hague Centrum, The Hague
Office space for rent in The Hague Centrum, The Hague
Areal
Ca. 40 m2
Pris pr. md.
Ca. 1,350 EUR per month
Område
The Hague Centrum, The Hague
Type
Office space
Selected customers
Selected customers
30,000 customers use Companyspace.com
30,000 customers
285,000 companies in our database
2,400 rentals annually
Companyspace.com is used by thousands of landlords, property companies, commercial real estate agents, investors and business centres seeking greater visibility, more enquiries and lower vacancy rates.


