


Commercial premises in Europe
Companyspace.com today:
New today 1,166
Updated 24h 1,183
Notifications about new companyspaces2,171
Copenhagen +5
Stockholm +6
Amsterdam +27
Berlin +2
Oslo +3
Brussels +12
Vienna +77
Paris +3
Madrid +1
Dublin (county) +49
Warsaw +16
Roma (region) +2
Latest update 11 min ago
Active ads 368,757
368,759 company spaces found
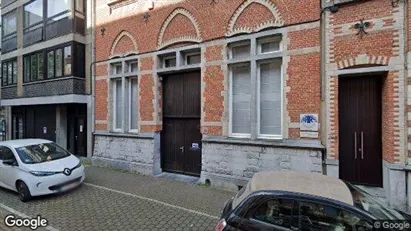
Commercial property in Oostende, West-Vlaanderen
 More info
Commercial property in Oostende, West-Vlaanderen
Commercial property for sale in Oostende, West-Vlaanderen
Areal
Ca. 340 m2
Pris
Ca. 850,000EUR
Område
Oostende, West-Vlaanderen
Type
Commercial property
Commercial property in Reykjavík Miðborg, Reykjavík
 More info
Commercial property in Reykjavík Miðborg, Reykjavík
Commercial property for sale in Reykjavík Miðborg, Reykjavík
Areal
Ca. 195 m2
Pris
Ca. 510,000EUR
Område
Reykjavík Miðborg, Reykjavík
Type
Commercial property
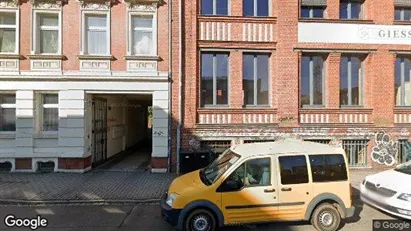
Office space in Leipzig, Sachsen
 More info
Office space in Leipzig, Sachsen
Office space for rent in Leipzig, Sachsen
Areal
Ca. 305 m2
Pris pr. md.
Not stated
Område
Leipzig, Sachsen
Type
Office space
Commercial property in Paisley - Renfrewshire, Paisley (Region)
 More info
Commercial property in Paisley - Renfrewshire, Paisley (Region)
Commercial property for sale in Paisley - Renfrewshire, Paisley (Region)
Areal
-
Pris
Ca. 230,000EUR
Område
Paisley - Renfrewshire, Paisley (Region)
Type
Commercial property
Commercial property in Aalst, Oost-Vlaanderen
 More info
Commercial property in Aalst, Oost-Vlaanderen
Commercial property for sale in Aalst, Oost-Vlaanderen
Areal
Ca. 2,440 m2
Pris
Ca. 1,950,000EUR
Område
Aalst, Oost-Vlaanderen
Type
Commercial property
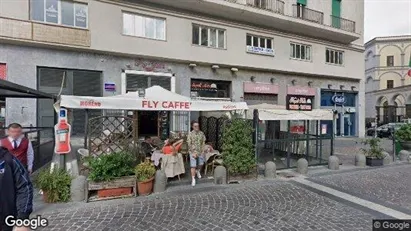
Commercial space in Napoli Municipalità 2, Napoli
 More info
Commercial space in Napoli Municipalità 2, Napoli
Commercial space for rent in Napoli Municipalità 2, Napoli
Areal
Ca. 210 m2
Pris pr. md.
Ca. 6,900 EUR pr md
Område
Napoli Municipalità 2, Napoli
Type
Commercial property
Commercial property in Oerle, Luik (region)
 More info
Commercial property in Oerle, Luik (region)
Commercial property for sale in Oerle, Luik (region)
Areal
Ca. 955 m2
Pris
Ca. 375,000EUR
Område
Oerle, Luik (region)
Type
Commercial property
Office space in Berlin Friedrichshain-Kreuzberg, Berlin
 More info
Office space in Berlin Friedrichshain-Kreuzberg, Berlin
Office space for rent in Berlin Friedrichshain-Kreuzberg, Berlin
Areal
Ca. 385 m2
Pris pr. md.
Not stated
Område
Berlin Friedrichshain-Kreuzberg, Berlin
Type
Office space
Office space in Roeselare, West-Vlaanderen
 More info
Office space in Roeselare, West-Vlaanderen
Office space for rent in Roeselare, West-Vlaanderen
Areal
Ca. 365 m2
Pris pr. md.
Ca. 15,550 EUR pr md
Område
Roeselare, West-Vlaanderen
Type
Office space
Commercial property in Fuengirola, Andalucía
 More info
Commercial property in Fuengirola, Andalucía
Commercial property for sale in Fuengirola, Andalucía
Areal
Ca. 15 m2
Pris
Ca. 185,000EUR
Område
Fuengirola, Andalucía
Type
Commercial property
Office space in Leipzig, Sachsen
 More info
Office space in Leipzig, Sachsen
Office space for rent in Leipzig, Sachsen
Areal
Ca. 50 m2
Pris pr. md.
Ca. 2,350 EUR pr md
Område
Leipzig, Sachsen
Type
Office space
Commercial property in Brugge, West-Vlaanderen
 More info
Commercial property in Brugge, West-Vlaanderen
Commercial property for sale in Brugge, West-Vlaanderen
Areal
Ca. 340 m2
Pris
Ca. 990,000EUR
Område
Brugge, West-Vlaanderen
Type
Commercial property
Commercial space in Almere, Flevoland
 More info
Commercial space in Almere, Flevoland
Commercial space for rent in Almere, Flevoland
Areal
-
Pris pr. md.
Ca. 1,950 EUR pr md
Område
Almere, Flevoland
Type
Commercial property
Office space in Leipzig, Sachsen
 More info
Office space in Leipzig, Sachsen
Office space for rent in Leipzig, Sachsen
Areal
Ca. 280 m2
Pris pr. md.
Not stated
Område
Leipzig, Sachsen
Type
Office space
Office space in Leipzig, Sachsen
 More info
Office space in Leipzig, Sachsen
Office space for rent in Leipzig, Sachsen
Areal
Ca. 130 m2
Pris pr. md.
Ca. 5,750 EUR pr md
Område
Leipzig, Sachsen
Type
Office space
Office space in Leipzig, Sachsen
 More info
Office space in Leipzig, Sachsen
Office space for rent in Leipzig, Sachsen
Areal
Ca. 90 m2
Pris pr. md.
Ca. 3,850 EUR pr md
Område
Leipzig, Sachsen
Type
Office space
Commercial space in Kortrijk, West-Vlaanderen
 More info
Commercial space in Kortrijk, West-Vlaanderen
Commercial space for rent in Kortrijk, West-Vlaanderen
Areal
-
Pris pr. md.
Ca. 1,500 EUR pr md
Område
Kortrijk, West-Vlaanderen
Type
Commercial property
Office space in Dublin 18, Dublin
 More info
Office space in Dublin 18, Dublin
Office space for rent in Dublin 18, Dublin
Areal
Ca. 25 m2
Pris pr. md.
Ca. 2,300 EUR pr md
Område
Dublin 18, Dublin
Type
Office space
Selected customers
30,000 customers use Companyspace.com
30,000 customers
285,000 companies in our database
2,400 rentals annually
Companyspace.com is used by thousands of landlords, property companies, commercial real estate agents, investors and business centres seeking greater visibility, more enquiries and lower vacancy rates.


