


Commercial premises in Europe
Companyspace.com today:
New today 1,786
Updated 24h 1,794
Notifications about new companyspaces2,158
Copenhagen +12
Stockholm +6
Amsterdam +2
Berlin +2
Brussels +11
Vienna +60
Paris +6
Madrid +2
Dublin (county) +19
Warsaw +8
Roma (region) +2
Lisbon +1
Latest update 2 min ago
Active ads 365,068
365,070 company spaces found
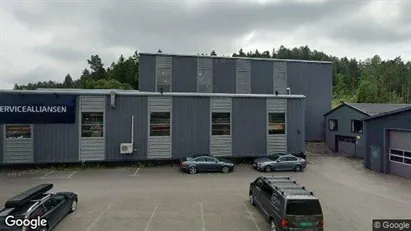
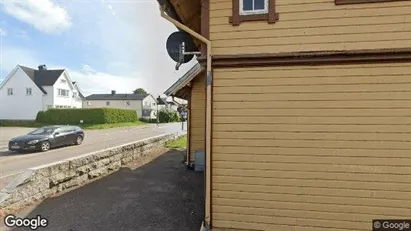
Commercial property in Sandefjord, Vestfold
 More info
Commercial property in Sandefjord, Vestfold
Commercial property for sale in Sandefjord, Vestfold
Areal
Ca. 290 m2
Pris
Ca. 49,000EUR
Område
Sandefjord, Vestfold
Type
Commercial property
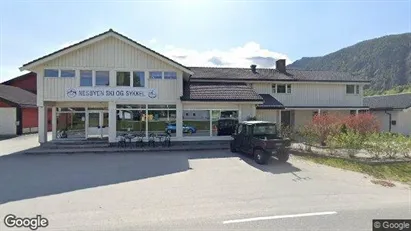
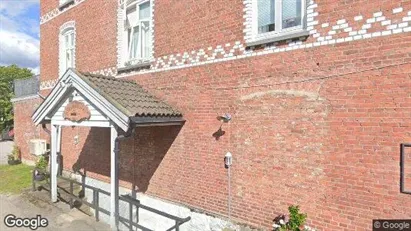
Commercial property in Nes, Buskerud
 More info
Commercial property in Nes, Buskerud
Commercial property for sale in Nes, Buskerud
Areal
Ca. 700 m2
Pris
Ca. 487,000EUR
Område
Nes, Buskerud
Type
Commercial property
Commercial property in Stord, Hordaland
 More info
Commercial property in Stord, Hordaland
Commercial property for sale in Stord, Hordaland
Areal
Ca. 145 m2
Pris
Ca. 197,000EUR
Område
Stord, Hordaland
Type
Commercial property
Commercial property in Nes, Akershus
 More info
Commercial property in Nes, Akershus
Commercial property for sale in Nes, Akershus
Areal
Ca. 710 m2
Pris
Ca. 1,770,000EUR
Område
Nes, Akershus
Type
Commercial property
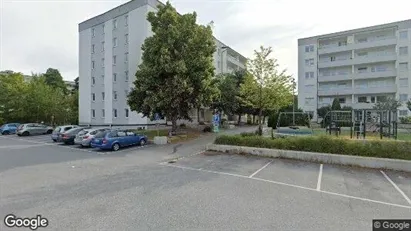
Commercial space in Södertälje, Stockholm County
 More info
Commercial space in Södertälje, Stockholm County
Commercial space for rent in Södertälje, Stockholm County
Areal
Ca. 5 m2
Pris pr. md.
Ca. 250 SEK per month
Område
Södertälje, Stockholm County
Type
Commercial property
Office property in Tønsberg, Vestfold
 More info
Office property in Tønsberg, Vestfold
Office space for sale in Tønsberg, Vestfold
Areal
Ca. 775 m2
Pris
Ca. 1,175,000EUR
Område
Tønsberg, Vestfold
Type
Office space
Commercial property in Marker, Østfold
 More info
Commercial property in Marker, Østfold
Commercial property for sale in Marker, Østfold
Areal
Ca. 1,625 m2
Pris
Ca. 1,957,000EUR
Område
Marker, Østfold
Type
Commercial property
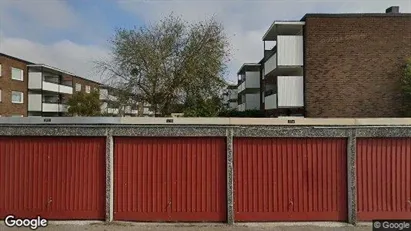
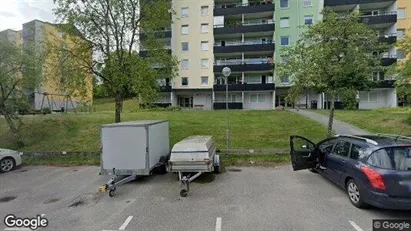
Commercial space in Södertälje, Stockholm County
 More info
Commercial space in Södertälje, Stockholm County
Commercial space for rent in Södertälje, Stockholm County
Areal
Ca. 15 m2
Pris pr. md.
Ca. 750 SEK per month
Område
Södertälje, Stockholm County
Type
Commercial property
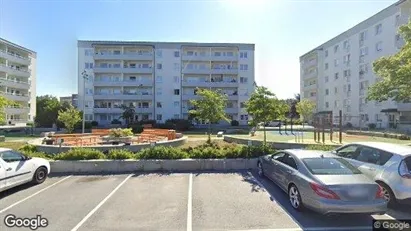
Commercial space in Upplands-Bro, Stockholm County
 More info
Commercial space in Upplands-Bro, Stockholm County
Commercial space for rent in Upplands-Bro, Stockholm County
Areal
Ca. 5 m2
Pris pr. md.
Ca. 250 SEK per month
Område
Upplands-Bro, Stockholm County
Type
Commercial property
Commercial space in Södertälje, Stockholm County
 More info
Commercial space in Södertälje, Stockholm County
Commercial space for rent in Södertälje, Stockholm County
Areal
Ca. 5 m2
Pris pr. md.
Ca. 250 SEK per month
Område
Södertälje, Stockholm County
Type
Commercial property
Commercial space in Södertälje, Stockholm County
 More info
Commercial space in Södertälje, Stockholm County
Commercial space for rent in Södertälje, Stockholm County
Areal
Ca. 15 m2
Pris pr. md.
Ca. 750 SEK per month
Område
Södertälje, Stockholm County
Type
Commercial property
Office property in Ringebu, Oppland
 More info
Office property in Ringebu, Oppland
Office space for sale in Ringebu, Oppland
Areal
Ca. 310 m2
Pris
Ca. 226,000EUR
Område
Ringebu, Oppland
Type
Office space
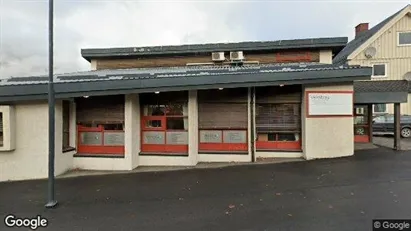
Commercial property in Skien, Telemark
 More info
Commercial property in Skien, Telemark
Commercial property for sale in Skien, Telemark
Areal
Ca. 490 m2
Pris
Ca. 678,000EUR
Område
Skien, Telemark
Type
Commercial property
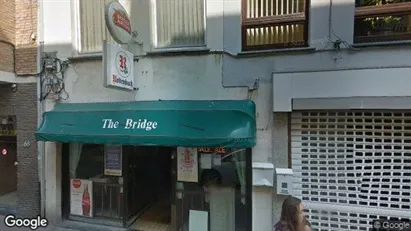
Commercial property in Oostende, West-Vlaanderen
 More info
Commercial property in Oostende, West-Vlaanderen
Commercial property for sale in Oostende, West-Vlaanderen
Areal
Ca. 285 m2
Pris
Ca. 350,000EUR
Område
Oostende, West-Vlaanderen
Type
Commercial property
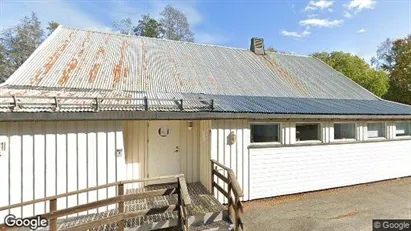
Industrial property in Vestre Toten, Oppland
 More info
Industrial property in Vestre Toten, Oppland
Industrial property for sale in Vestre Toten, Oppland
Areal
Ca. 180 m2
Pris
Ca. 196,000EUR
Område
Vestre Toten, Oppland
Type
Industrial property
Commercial space in Roskilde, Greater Copenhagen
 More info
Commercial space in Roskilde, Greater Copenhagen
Commercial space for rent in Roskilde, Greater Copenhagen
Areal
Ca. 990 m2
Pris pr. md.
Ca. 53,750 DKK per month
Område
Roskilde, Greater Copenhagen
Type
Commercial property
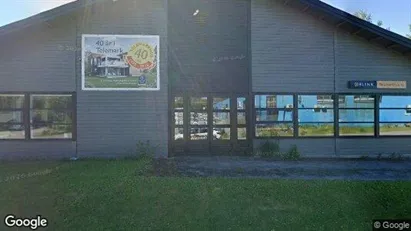
Commercial property in Skien, Telemark
 More info
Commercial property in Skien, Telemark
Commercial property for sale in Skien, Telemark
Areal
Ca. 2,860 m2
Pris
Ca. 2,557,000EUR
Område
Skien, Telemark
Type
Commercial property
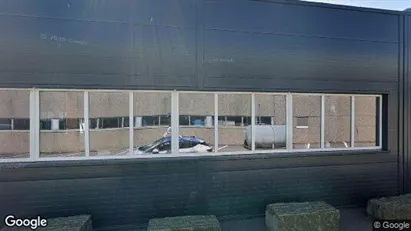
Warehouse property in Sykkylven, Møre og Romsdal
 More info
Warehouse property in Sykkylven, Møre og Romsdal
Warehouse for sale in Sykkylven, Møre og Romsdal
Areal
Ca. 70 m2
Pris
Ca. 137,000EUR
Område
Sykkylven, Møre og Romsdal
Type
Warehouse
Selected customers


