


Commercial premises in Europe
Companyspace.com today:
New today 435
Updated 24h 983
Notifications about new companyspaces1,667
Copenhagen +4
Amsterdam +1
Berlin +3
Brussels +2
Vienna +4
Dublin (county) +19
Warsaw +12
Roma (region) +1
Latest update 42 min ago
Active ads 364,389
364,391 company spaces found
Restaurant in Tiel, Gelderland
 More info
Restaurant in Tiel, Gelderland
Horeca pand te huur in Tiel, Gelderland
Areal
Ca. 240 m2
Pris pr. md.
Ca. 3,500 EUR per month
Område
Tiel, Gelderland
Type
Restaurant
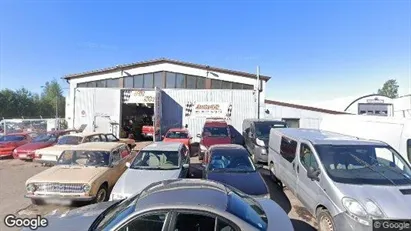
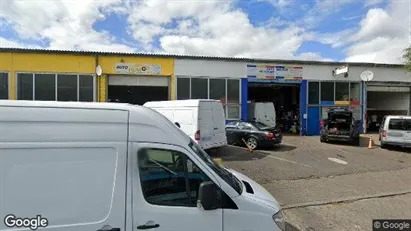
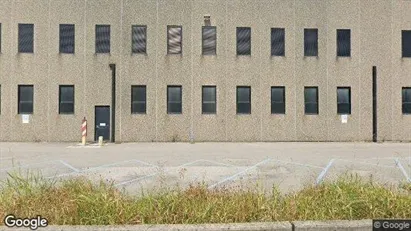
Industrial property in Helsinki Koillinen, Helsinki
 More info
Industrial property in Helsinki Koillinen, Helsinki
Industrial property for rent in Helsinki Koillinen, Helsinki
Areal
Ca. 185 m2
Pris pr. md.
Ca. 1,350 EUR per month
Område
Helsinki Koillinen, Helsinki
Type
Industrial property
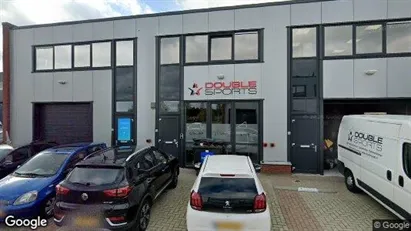
Commercial space in Pijnacker-Nootdorp, South Holland
 More info
Commercial space in Pijnacker-Nootdorp, South Holland
Commercial space for rent in Pijnacker-Nootdorp, South Holland
Areal
Ca. 220 m2
Pris pr. md.
Ca. 3,950 EUR per month
Område
Pijnacker-Nootdorp, South Holland
Type
Commercial property
Restaurant in Leiden, South Holland
More info
Restaurant in Leiden, South Holland
Horeca pand te huur in Leiden, Zuid-Holland
Areal
Ca. 95 m2
Pris pr. md.
Ca. 3,050 EUR per month
Område
Leiden, South Holland
Type
Restaurant
Restaurant in Eindhoven, North Brabant
More info
Restaurant in Eindhoven, North Brabant
Horeca pand te huur in Eindhoven, Noord-Brabant
Areal
Ca. 200 m2
Pris pr. md.
Ca. 3,900 EUR per month
Område
Eindhoven, North Brabant
Type
Restaurant
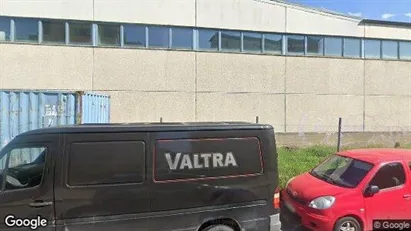
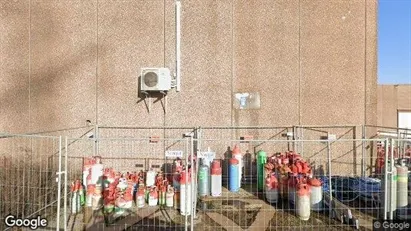
Industrial property in Helsinki Koillinen, Helsinki
 More info
Industrial property in Helsinki Koillinen, Helsinki
Industrial property for rent in Helsinki Koillinen, Helsinki
Areal
Ca. 190 m2
Pris pr. md.
Ca. 1,800 EUR per month
Område
Helsinki Koillinen, Helsinki
Type
Industrial property
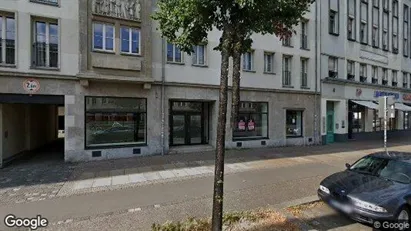
Office space in Leipzig, Sachsen
 More info
Office space in Leipzig, Sachsen
Office space for rent in Leipzig, Sachsen
Areal
Ca. 150 m2
Pris pr. md.
Not stated
Område
Leipzig, Sachsen
Type
Office space
Office space in Amsterdam Centrum, Amsterdam
 More info
Office space in Amsterdam Centrum, Amsterdam
Kantoor te huur in Amsterdam Centrum, Amsterdam
Areal
14 - 75 m2
Pris pr. md.
Ca. 950 EUR per month
Område
Amsterdam Centrum, Amsterdam
Type
Office space
Industrial property in Nuremberg, Bayern
 More info
Industrial property in Nuremberg, Bayern
Industrial property for rent in Nuremberg, Bayern
Areal
-
Pris pr. md.
Ca. 4,400,000 EUR per month
Område
Nuremberg, Bayern
Type
Industrial property
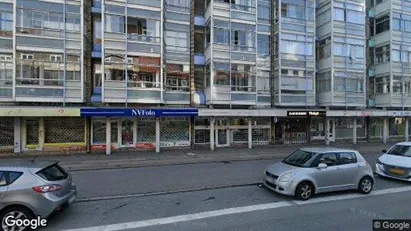
Office space in Copenhagen NV, Copenhagen
 More info
Office space in Copenhagen NV, Copenhagen
Office space for rent in Copenhagen NV, Copenhagen
Areal
Ca. 305 m2
Pris pr. md.
Not stated
Område
Copenhagen NV, Copenhagen
Type
Office space
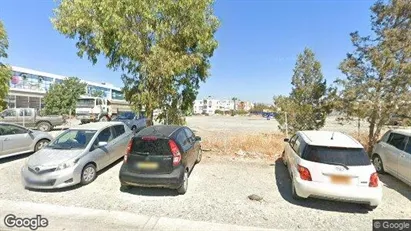
Commercial property in Limassol, Limassol (Eparchies)
 More info
Commercial property in Limassol, Limassol (Eparchies)
Commercial property for sale in Limassol, Limassol (Eparchies)
Areal
Ca. 970 m2
Pris
Ca. 5,169,000EUR
Område
Limassol, Limassol (Eparchies)
Type
Commercial property
Office property in Alhaurín el Grande, Andalucía
 More info
Office property in Alhaurín el Grande, Andalucía
Office space for sale in Alhaurín el Grande, Andalucía
Areal
Ca. 95 m2
Pris
Ca. 360,000EUR
Område
Alhaurín el Grande, Andalucía
Type
Office space
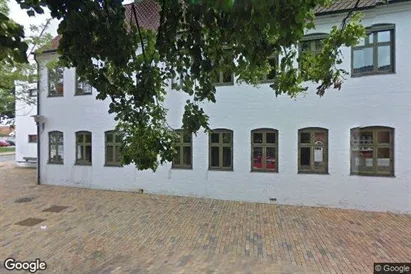
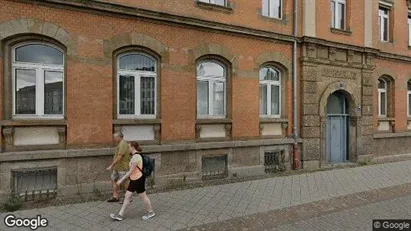
Office space in Aabenraa, Region of Southern Denmark
 More info
Office space in Aabenraa, Region of Southern Denmark
Office space for rent in Aabenraa, Region of Southern Denmark
Areal
Ca. 250 m2
Pris pr. md.
Ca. 10,300 DKK per month
Område
Aabenraa, Region of Southern Denmark
Type
Office space
Office space in Piraeus, Attica
 More info
Office space in Piraeus, Attica
Office space for rent in Piraeus, Attica
Areal
-
Pris pr. md.
Not stated
Område
Piraeus, Attica
Type
Office space
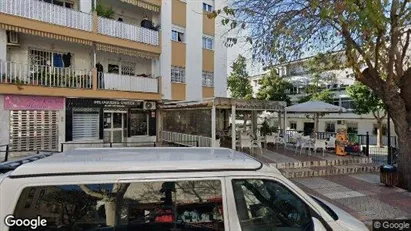
Commercial property in Marbella, Andalucía
 More info
Commercial property in Marbella, Andalucía
Commercial property for sale in Marbella, Andalucía
Areal
Ca. 45 m2
Pris
Ca. 200,000EUR
Område
Marbella, Andalucía
Type
Commercial property
Office space in Vantaa, Uusimaa
 More info
Office space in Vantaa, Uusimaa
Office space for rent in Vantaa, Uusimaa
Areal
Ca. 600 m2
Pris pr. md.
Not stated
Område
Vantaa, Uusimaa
Type
Office space
Commercial space in Arosio, Lombardia
 More info
Commercial space in Arosio, Lombardia
Commercial space for rent in Arosio, Lombardia
Areal
Ca. 2,230 m2
Pris pr. md.
Ca. 19,500 EUR per month
Område
Arosio, Lombardia
Type
Commercial property
Office space in Leipzig, Sachsen
 More info
Office space in Leipzig, Sachsen
Office space for rent in Leipzig, Sachsen
Areal
Ca. 2,175 m2
Pris pr. md.
Not stated
Område
Leipzig, Sachsen
Type
Office space
Selected customers
Selected customers
30,000 customers use Companyspace.com
30,000 customers
285,000 companies in our database
2,400 rentals annually
Companyspace.com is used by thousands of landlords, property companies, commercial real estate agents, investors and business centres seeking greater visibility, more enquiries and lower vacancy rates.


