


Commercial premises in Europe
Companyspace.com today:
New today 1
Updated 24h 807
Latest update 1 min ago
Active ads 365,994
365,996 company spaces found
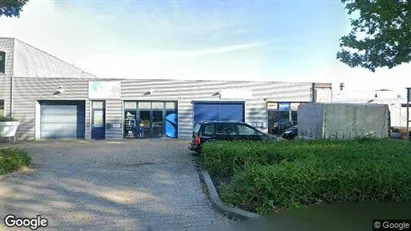
Warehouse in Doetinchem, Gelderland
 More info
Warehouse in Doetinchem, Gelderland
Warehouse for rent in Doetinchem, Gelderland
Areal
Ca. 185 m2
Pris pr. md.
Ca. 1,450 EUR per month
Område
Doetinchem, Gelderland
Type
Warehouse
Commercial space in Eindhoven, North Brabant
 More info
Commercial space in Eindhoven, North Brabant
Commercial space for rent in Eindhoven, North Brabant
Areal
Ca. 320 m2
Pris pr. md.
Ca. 2,950 EUR per month
Område
Eindhoven, North Brabant
Type
Commercial property
Office space in Alkmaar, North Holland
 More info
Office space in Alkmaar, North Holland
Office space for rent in Alkmaar, North Holland
Areal
Ca. 70 m2
Pris pr. md.
Ca. 750 EUR per month
Område
Alkmaar, North Holland
Type
Office space
Office space in Breda, North Brabant
 More info
Office space in Breda, North Brabant
Office space for rent in Breda, North Brabant
Areal
Ca. 110 m2
Pris pr. md.
Ca. 1,750 EUR per month
Område
Breda, North Brabant
Type
Office space
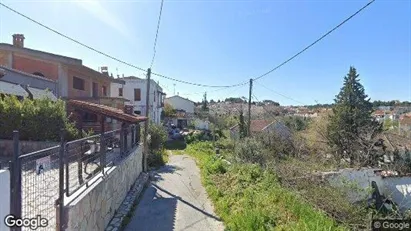
Real estate land in Thermaikos, Central Macedonia
 More info
Real estate land in Thermaikos, Central Macedonia
Land for sale in Thermaikos, Central Macedonia
Areal
-
Pris
Ca. 67,000EUR
Område
Thermaikos, Central Macedonia
Type
Land
Office space in Odense C, Odense
 More info
Office space in Odense C, Odense
Office space for rent in Odense C, Odense
Areal
Ca. 265 m2
Pris pr. md.
Ca. 19,000 DKK per month
Område
Odense C, Odense
Type
Office space
Office space in Dafni, Attica
 More info
Office space in Dafni, Attica
Office space for rent in Dafni, Attica
Areal
Ca. 5 m2
Pris pr. md.
Ca. 6,500 EUR per month
Område
Dafni, Attica
Type
Office space
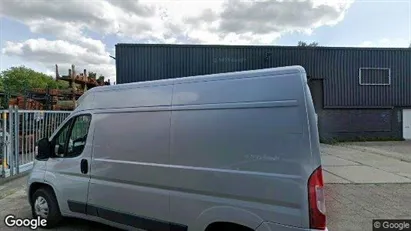
Warehouse in Doetinchem, Gelderland
 More info
Warehouse in Doetinchem, Gelderland
Warehouse for rent in Doetinchem, Gelderland
Areal
Ca. 415 m2
Pris pr. md.
Ca. 2,800 EUR per month
Område
Doetinchem, Gelderland
Type
Warehouse
Commercial property in Diest, Vlaams-Brabant
 More info
Commercial property in Diest, Vlaams-Brabant
Commercial property for sale in Diest, Vlaams-Brabant
Areal
-
Pris
Ca. 595,000EUR
Område
Diest, Vlaams-Brabant
Type
Commercial property
Commercial space in Tampere Keskinen, Tampere
 More info
Commercial space in Tampere Keskinen, Tampere
Commercial space for rent in Tampere Keskinen, Tampere
Areal
Ca. 245 m2
Pris pr. md.
Not stated
Område
Tampere Keskinen, Tampere
Type
Commercial property
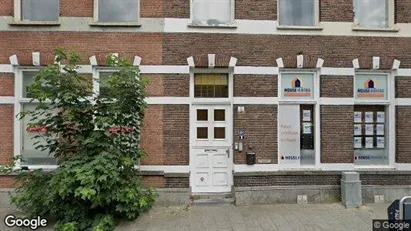
Office space in Sittard-Geleen, Limburg
 More info
Office space in Sittard-Geleen, Limburg
Office space for rent in Sittard-Geleen, Limburg
Areal
Ca. 110 m2
Pris pr. md.
Ca. 1,250 EUR per month
Område
Sittard-Geleen, Limburg
Type
Office space
Commercial space in Norrköping, Östergötland County
More info
Commercial space in Norrköping, Östergötland County
Commercial space for rent in Norrköping, Östergötland County
Areal
Ca. 80 m2
Pris pr. md.
Ca. 8,500 SEK per month
Område
Norrköping, Östergötland County
Type
Commercial property
Commercial property in Katwijk, South Holland
 More info
Commercial property in Katwijk, South Holland
Commercial property for sale in Katwijk, South Holland
Areal
-
Pris
Ca. 1,250,000EUR
Område
Katwijk, South Holland
Type
Commercial property
Commercial space in Napoli Municipalità 4, Napoli
 More info
Commercial space in Napoli Municipalità 4, Napoli
Commercial space for rent in Napoli Municipalità 4, Napoli
Areal
Ca. 85 m2
Pris pr. md.
Ca. 1,100 EUR per month
Område
Napoli Municipalità 4, Napoli
Type
Commercial property
Commercial property in Langedijk, North Holland
 More info
Commercial property in Langedijk, North Holland
Commercial property for sale in Langedijk, North Holland
Areal
Ca. 335 m2
Pris
Ca. 160,000EUR
Område
Langedijk, North Holland
Type
Commercial property
Commercial space in Pori, Satakunta
 More info
Commercial space in Pori, Satakunta
Commercial space for rent in Pori, Satakunta
Areal
Ca. 20 m2
Pris pr. md.
Ca. 300 EUR per month
Område
Pori, Satakunta
Type
Commercial property
Commercial space in Łódź, Łódzkie
 More info
Commercial space in Łódź, Łódzkie
Commercial space for rent in Łódź, Łódzkie
Areal
Ca. 1,560 m2
Pris pr. md.
Ca. 31,200 PLN per month
Område
Łódź, Łódzkie
Type
Commercial property
Commercial space in Vantaa, Uusimaa
 More info
Commercial space in Vantaa, Uusimaa
Commercial space for rent in Vantaa, Uusimaa
Areal
Ca. 50 m2
Pris pr. md.
Not stated
Område
Vantaa, Uusimaa
Type
Commercial property
Selected customers
Selected customers
30,000 customers use Companyspace.com
30,000 customers
285,000 companies in our database
2,400 rentals annually
Companyspace.com is used by thousands of landlords, property companies, commercial real estate agents, investors and business centres seeking greater visibility, more enquiries and lower vacancy rates.


